Python | Implementation of Movie Recommender System
Recommender System is a system that seeks to predict or filter preferences according to the user’s choices. Recommender systems are utilized in a variety of areas including movies, music, news, books, research articles, search queries, social tags, and products in general.
Recommender systems produce a list of recommendations in any of the two ways –
- Collaborative filtering: Collaborative filtering approaches build a model from the user’s past behavior (i.e. items purchased or searched by the user) as well as similar decisions made by other users. This model is then used to predict items (or ratings for items) that users may have an interest in.
- Content-based filtering: Content-based filtering approaches uses a series of discrete characteristics of an item in order to recommend additional items with similar properties. Content-based filtering methods are totally based on a description of the item and a profile of the user’s preferences. It recommends items based on the user’s past preferences.
Let’s develop a basic recommendation system using Python and Pandas.
Let’s focus on providing a basic recommendation system by suggesting items that are most similar to a particular item, in this case, movies. It just tells what movies/items are most similar to the user’s movie choice.
To download the files, click on the links – .tsv file, Movie_Id_Titles.csv.
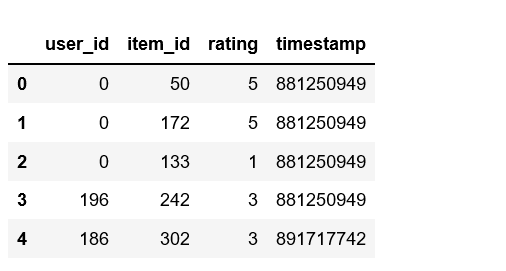
Import dataset with delimiter “\t” as the file is a tsv file (tab-separated file).
# import pandas libraryimport pandas as pd # Get the datacolumn_names = ['user_id', 'item_id', 'rating', 'timestamp'] path = 'https://media.geeksforgeeks.org/wp-content/uploads/file.tsv' df = pd.read_csv(path, sep='\t', names=column_names) # Check the head of the datadf.head() |
- Python3
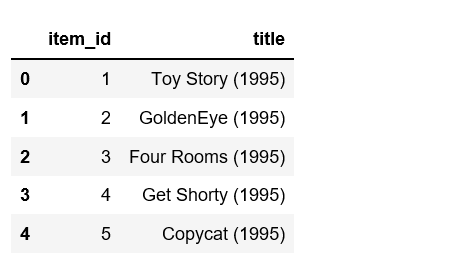
# Check out all the movies and their respective IDsmovie_titles = pd.read_csv('https://media.geeksforgeeks.org/wp-content/uploads/Movie_Id_Titles.csv')movie_titles.head() |
- Python3
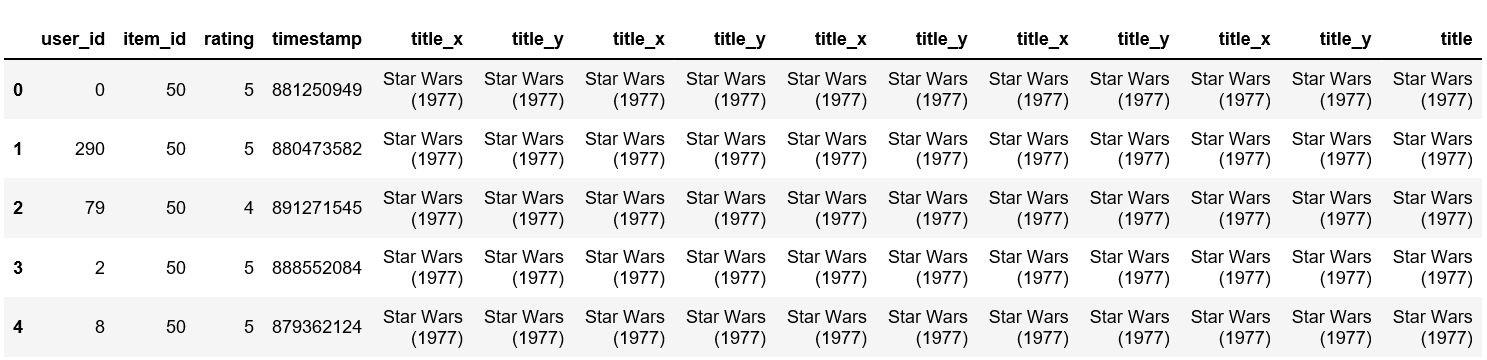
data = pd.merge(df, movie_titles, on='item_id')data.head() |
- Python3
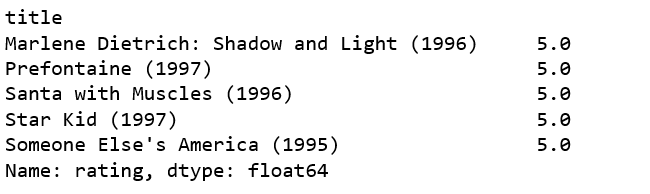
# Calculate mean rating of all moviesdata.groupby('title')['rating'].mean().sort_values(ascending=False).head() |
- Python3
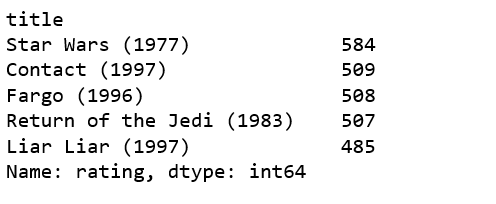
# Calculate count rating of all moviesdata.groupby('title')['rating'].count().sort_values(ascending=False).head() |
- Python3
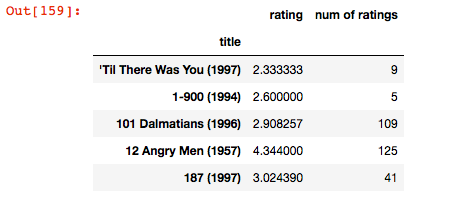
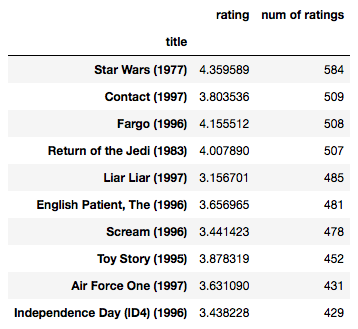
# creating dataframe with 'rating' count valuesratings = pd.DataFrame(data.groupby('title')['rating'].mean()) ratings['num of ratings'] = pd.DataFrame(data.groupby('title')['rating'].count()) ratings.head() |
Visualization imports:
- Python3
import matplotlib.pyplot as pltimport seaborn as sns sns.set_style('white')%matplotlib inline |
- Python3
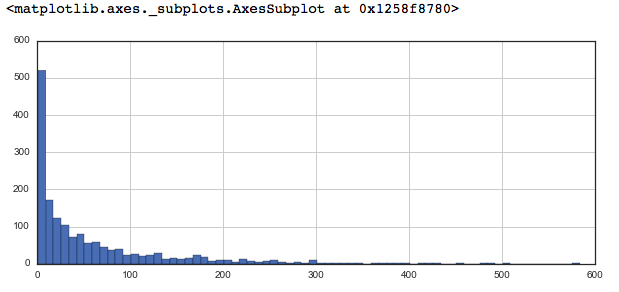
# plot graph of 'num of ratings column'plt.figure(figsize =(10, 4)) ratings['num of ratings'].hist(bins = 70) |
- Python3
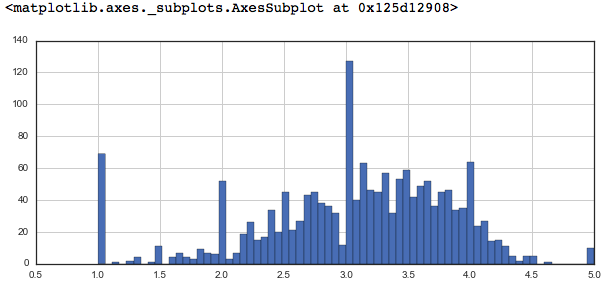
# plot graph of 'ratings' columnplt.figure(figsize =(10, 4)) ratings['rating'].hist(bins = 70) |
- Python3
# Sorting values according to # the 'num of rating column'moviemat = data.pivot_table(index ='user_id', columns ='title', values ='rating') moviemat.head() ratings.sort_values('num of ratings', ascending = False).head(10) |
- Python3
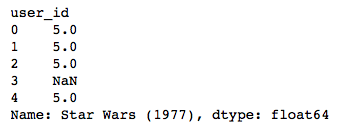
# analysing correlation with similar moviesstarwars_user_ratings = moviemat['Star Wars (1977)']liarliar_user_ratings = moviemat['Liar Liar (1997)'] starwars_user_ratings.head() |
- Python3
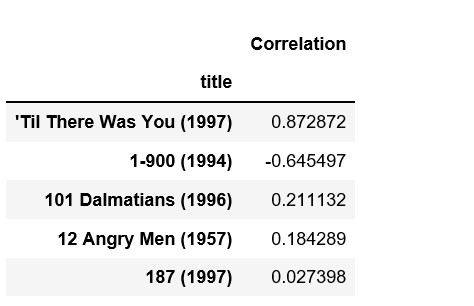
# analysing correlation with similar moviessimilar_to_starwars = moviemat.corrwith(starwars_user_ratings)similar_to_liarliar = moviemat.corrwith(liarliar_user_ratings) corr_starwars = pd.DataFrame(similar_to_starwars, columns =['Correlation'])corr_starwars.dropna(inplace = True) corr_starwars.head() |
- Python3
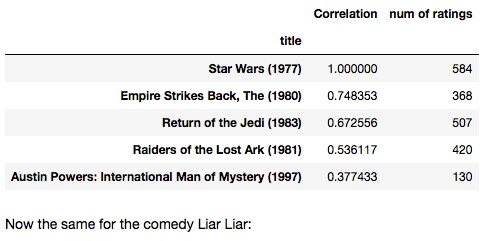
# Similar movies like starwarscorr_starwars.sort_values('Correlation', ascending = False).head(10)corr_starwars = corr_starwars.join(ratings['num of ratings']) corr_starwars.head() corr_starwars[corr_starwars['num of ratings']>100].sort_values('Correlation', ascending = False).head() |
- Python3
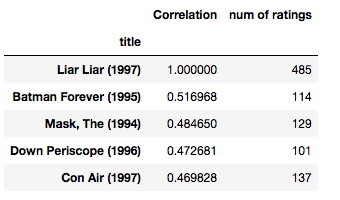
# Similar movies as of liarliarcorr_liarliar = pd.DataFrame(similar_to_liarliar, columns =['Correlation'])corr_liarliar.dropna(inplace = True) corr_liarliar = corr_liarliar.join(ratings['num of ratings'])corr_liarliar[corr_liarliar['num of ratings']>100].sort_values('Correlation', ascending = False).head() |
 Australia
  UK
UK  UAE
UAE  Singapore
  Canada
  New
Zealand
New
Zealand  Malaysia
  USA
USA  India
India  South
Africa
South
Africa  Ireland
  Saudi
Arab
Saudi
Arab  Qatar
Qatar  Kuwait
  Hongkong